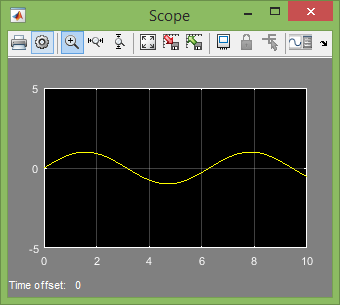
- After the simulation is complete double click on scopeand the sine wavewill be displayed.
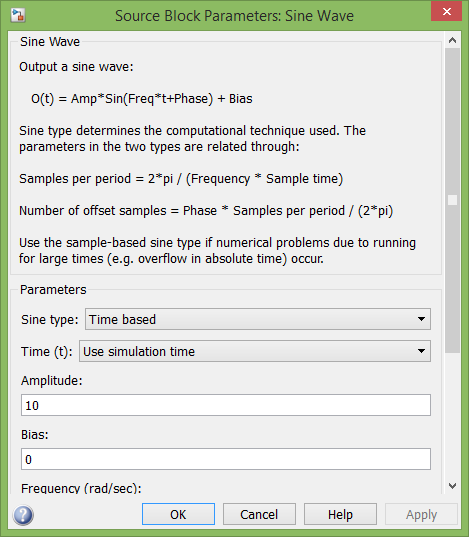
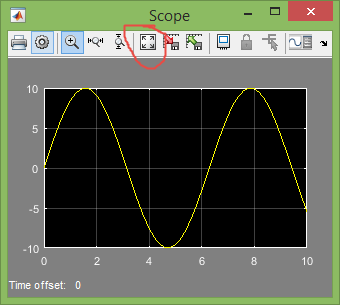
- To change the amplitude of the sine wave simply double click on the sine wave and change the amplitude to say 10.Now run the simulation again and after the simulation is complete double click on the scope and the graph will be dispalyed with magnitude 10.
- If the graph is doesn’t appear properly click auto-fit.
Hence the analysis is complete.
Suppose our function is y=5sin(x)+3
Repeat the same steps as mentioned above but in between the sine wave block and scope the modification will be given in the figure below.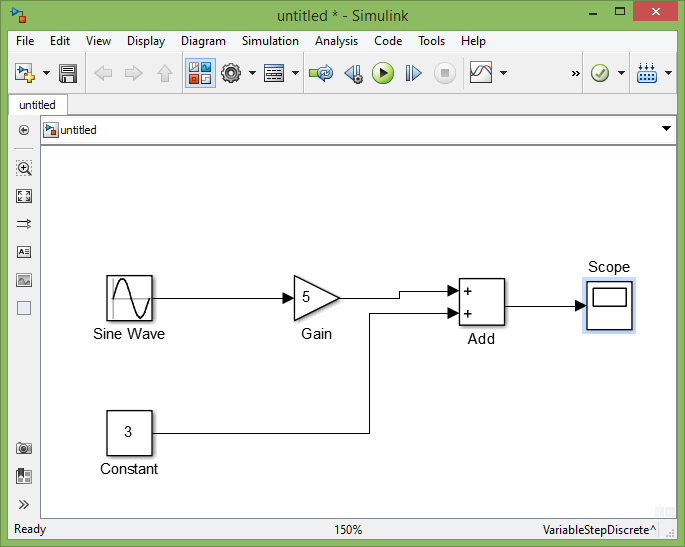
Note:
- The gain add blocks can be found in Mathematical Operations.
- Constants block can be found in sources.
Assignment
Plot the following functions using simulink
- sin(x)⁄|sin(x)|
- e|sin(x)|