EEG, short form of Electro-encephalogram, is the study of electrical signals taken from the brain-scalp. The electrical part of the brain comprises of about 86 billion nerve cells (neurons), the “gray matter” connected together in a massive parallel fashion. The capabilities of human brain have always been a mystery. It is believed that the human brain is even more powerful than the ultra-modern super-computers. No computer built till date has the capability of taking decisions by its own as done by the human brain, or learns from data as efficiently as done by human brain.
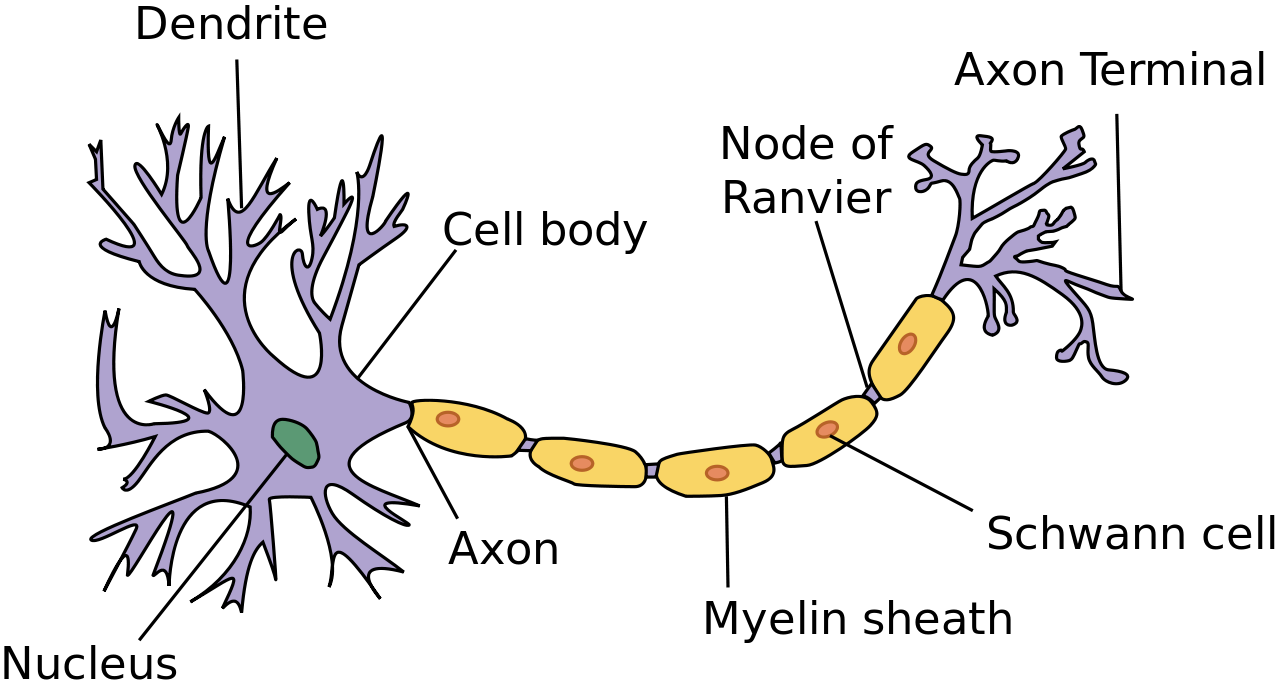
[Sketch of a neuron.. Courtesy: Wikipedia]
A neuron receives signal (impulses) from other neurons through its dentrites (receivers) and transmits the signals generated by its cell body along the axon(transmitter) which eventually branches into strands and substrands. When the impulse reaches the synapse’s terminal, certain chemicals called neuro-transmitters are released. Neuro-transmitter contains ions, and their motion contribute to the electric fluctuations which are extracted as EEG.
10-20 International System
 This is the normally used international standard for placing the electrodes. This method was developed to ensure standardized reproducibility so that a subject’s studies could be compared over time. And subjects could be compared each other.The “10” and “20” refer to the fact that the actual distances between adjacent electrodes are either 10% or 20% of the total front-back or right-left distance of the skull.
According to the 10-20 System, each site on the human scalp is assigned a letter to identify the lobe and a number to identify the hemisphere location.
Applications
- Mind controlled robotic systems – e.g. humanoid, quad copter etc.
- Home automation.
- In Medical field E.g.: detection of diseases like Epilepsy, monitoring of drowsiness of vehicle drivers.
- Computer game development using Brain Computer Interface.
- Nonverbal communication.
Sketch of EEG signals for different mental states
Now Let’s come to a few Terminologies.

What is ‘Feature Extraction’?
The classification of brain signals according to different emotions, thoughts etc. cannot be done by simply analyzing the amplitude variation or the frequency variations. The brain signals are highly stochastic, and unpredictable. You would probably be stuck up if you are going to simply look upon the flow of signals. Here you need some special algorithms that guide you to do your task, i.e. to classify your signals. After performing such algorithms you get what is called the so called feature that has much more simpler data that may be unique (or at least similar for each) for the classes that you are trying to classify
E.g. – Common Spatial Patterns, Autoregressive coefficients, Higuchi Fractal dimension, Shannon Entropy etc.
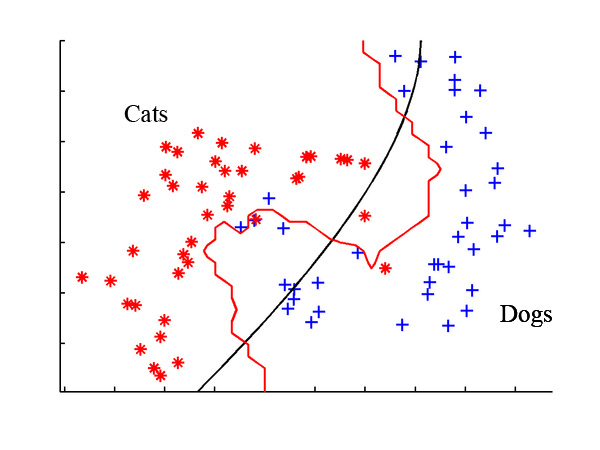
What is ‘Classification’?
In machine learning and statistics, classification is the problem of identifying to which of a set of categories (sub-populations) a new observation belongs, on the basis of a training set of data containing observations (or instances) whose category membership is known. [Wikipedia]Eg- Support Vector Machines, Linear Discriminant Analysis, Neural Networks, Hidden Markov Model etcConsider the following simple case: The picture depicts the plot where red dots represent the cats and the blue represents the dogs. When we give the plot and the details of the plot to train the classifier, the classifier finds out the ways to separate the two classes. Here the two lines represent the classifiers. As you can see the red line will be a better classifier
Few Theory
Shannon Entropy
The word ’entropy’ usually stands for disorder or uncertainty. There are cases in EEG signal processing where Entropy is calculated to find out the amount of information contained in the signal to be used as a feature. Shannon Entropy provides an approximation for this. The Shannon Entropy of a signal can be computed as shown:
H(X) = E [ -ln{P(X)} ]
Where P(X) is the probability mass function and E is expected value operator.
Autoregressive modeling
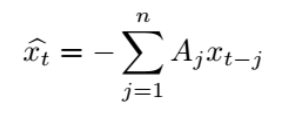
For applying the Auto-regressive modeling to EEG signals, we assume that the EEG signal is affected by additive white Gaussian noise too. Here the model says that the output at any given point of time can be estimated from its present and previous time values.nth order autoregressive process can be represented as:
xt = -j xt-j + t
Where Aj are m * m matrices of model coefficients and t is the prediction error. The model coefficients can be estimated by means of a least squares procedure which minimizes the sum of squared errors. This results in the Yule-Walker equation.
where
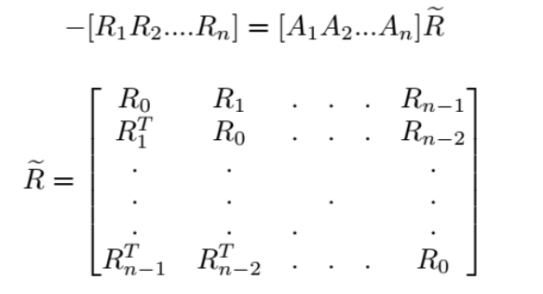
which must be solved for A(i), i=1,2,…….n. The prediction error t can be calculated as
Wavelet decomposition
Wavelet transform is a method by which any signal or function can be expressed as a series of wavelets. The concept underlying the transform is the representation of a signal as a linear combination of a set of functions obtained by time shifting and dilating a wavelet (mother wavelet). The decomposition of the signal yields a set of coefficients known as wavelet coefficients. Doing wavelet decomposition is highly important in EEG signal processing since various brain activities are frequency dependent. Also it is highly advantageous over Fourier analysis, which when used causes loss of important data in the frequency domain. This problem can be solved by using STFT (Short Time Fourier Transform), but in its case the time window chosen must be uniform throughout. This results in loss of important data at very low or high frequencies. Wavelet decomposition proves to be highly advantageous as it allows high time resolution at high frequencies and high
frequency resolution at low frequencies.
The DWT is defined as:

where 2j is the scaling parameter and k2j is the translation parameter.
Frequency sub bands are related to the original sampling frequency by the equation:
Fm = fs/2l
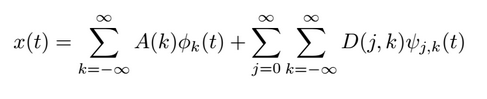
where l is the level of decomposition. The equation holds only if the signal has not been down sampled.Decomposition at any level provides the detail coefficient Dj with the frequency sub-band [fm: 2fm] and approximation coefficient Aj with sub-band [0:fm].The wavelet decomposition for any given signal x(t) can be represented in terms of its decomposition coefficients as shown:
Selection of a suitable wavelet is of considerable importance in EEG signal processing. Daubechies wavelets, known for their ‘orthogonality’ property and smoothing features, are used as it is suitable for detecting changes in EEG signals.
Several Options to start with:
- OpenVibe Designer [Given below is the case if you have the Neuro-Sky Mindwave headset
- Offline signal processing of EEG in Matlab